Member-only story
Visual Headers in Power BI
A complete guide to mastering visual headers and icons in Power BI — Part 1

This article is also available at bits 2 BI
Visual headers in Power BI offer a rich set of actions to the report end-users. A visual header in Power BI is the set of icons that pops up when you hover over a visual such as charts, maps, heat maps, etc. Visual headers extend the functionalities and enrich the user experience, readability, and interaction.
A report author can control the visibility of options (icons) available in the visual header. Power BI offers a great deal of flexibility to manage some of these icons at the individual visual level, while others are managed at the report or page level.
This article discusses the visual headers, their behavior, and how to control the visibility and appearance of header icons.
Please read our terms of use before proceeding with this article: https://dhyanintech.medium.com/disclaimer-disclosure-terms-of-use-fb3bfbd1e0e5
Report & Page Settings
Before we dig into the visual headers, it’s essential to discuss a few report and page level settings that affect the availability and behavior of icons in the visual header for a report developer and the end-users. You can set them for your report in Power BI Desktop or Power BI Service.
- Power BI Desktop: File > Options and settings > Options > CURRENT FILE > Report settings
- Power BI Service: Workspace > select more options for the report (⋮)> Settings
Visual Header Visibility and Styling
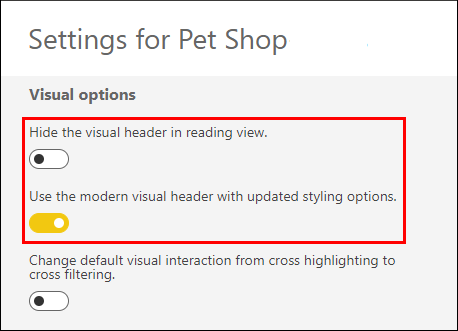
The visual options section contains two important settings that let developers control and hide the visual headers for all the visuals in the report.

- Hide the visual header in the reading view: This setting has precedence over the individual visual level header visibility and can be helpful in scenarios where you want to hide visual headers for all the report elements for the end-users.
